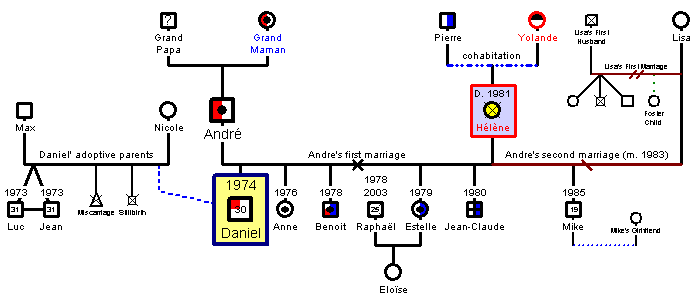
The purpose of this is to show trends that are either good or bad. Modern marriage and family therapists believe that it takes three to four generations for bad trends to dissolve out of the family. When we put together a genogram, we can see these trends and cut these trends out. It would have been very interesting to look at some of the other trends that I am not that aware of. My wife's family has an odd and unique trend that for some reasons I will not go into. But, the main point is that the genogram is used to find trends and we can either keep them alive or we can try to stop the trend.
No comments:
Post a Comment